Silver Price Analysis: XAG/USD limited below key resistance at $24.60 area
- Silver recovery halts at the $24.60 resistance area.
- The confluence of 50% Fibo retracement and the 50- and 100-hour SMAs is holding down the XAG/USD.
- The overall near-term trend remains positive while above $24.10.
XAG/USD’s upside attempt seen earlier today has been capped at $24.65 on Wednesday’s US session. Silver has pulled back as US dollar bounced up across the board and remains barely changed on the day at the time of writing.
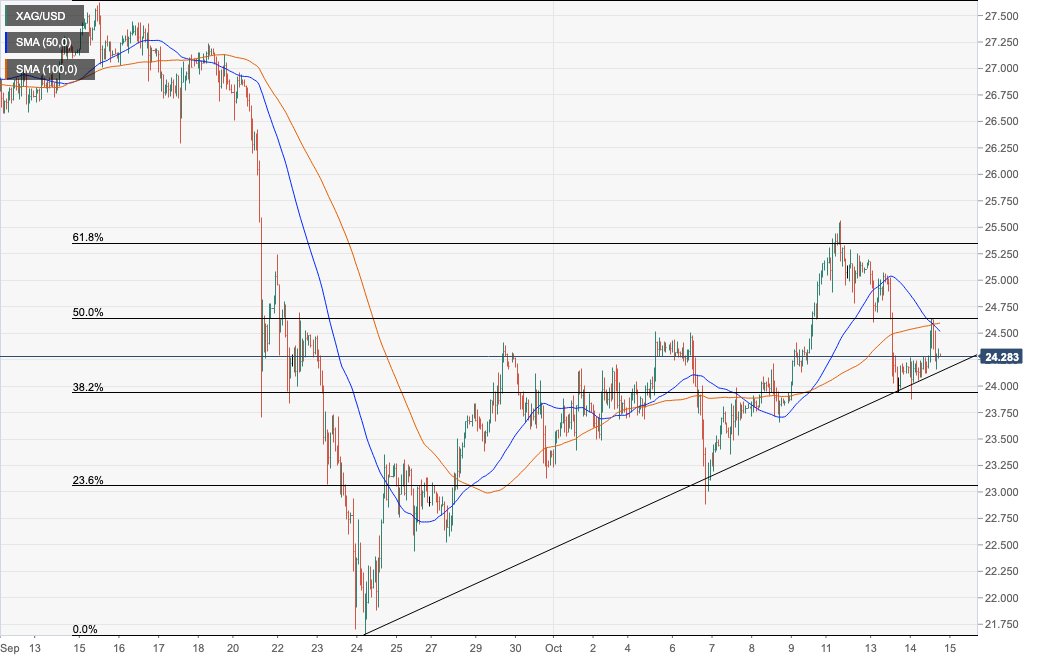
The hourly chart shows the white metal is still trending higher, posting higher tops and lows since bottoming at $21.65 in late September. The pair, however, seems capped below $24.60, where the 50% Fibonacci retracement level of the September 15-24 sell-off meets the confluence of the 50 and 100-hour SMAs.
A clear break above here would confirm the bullish pattern and provide confidence to the bulls to climb towards $25.05 (October 13 high) before testing October’s peak, at $25.55.
On the downside, the upward trendline support from September 26 low (now around $24.15) defends the upside bias. Below here, a clear break below the 38.2% Fibonacci retracement of the September 15-24 drop might increase bearish traction, sending the pair towards $23.63 (October 8 low) and $22.90 (October 6 low).
XAG/USD hourly chart
XAG/USD technical levels