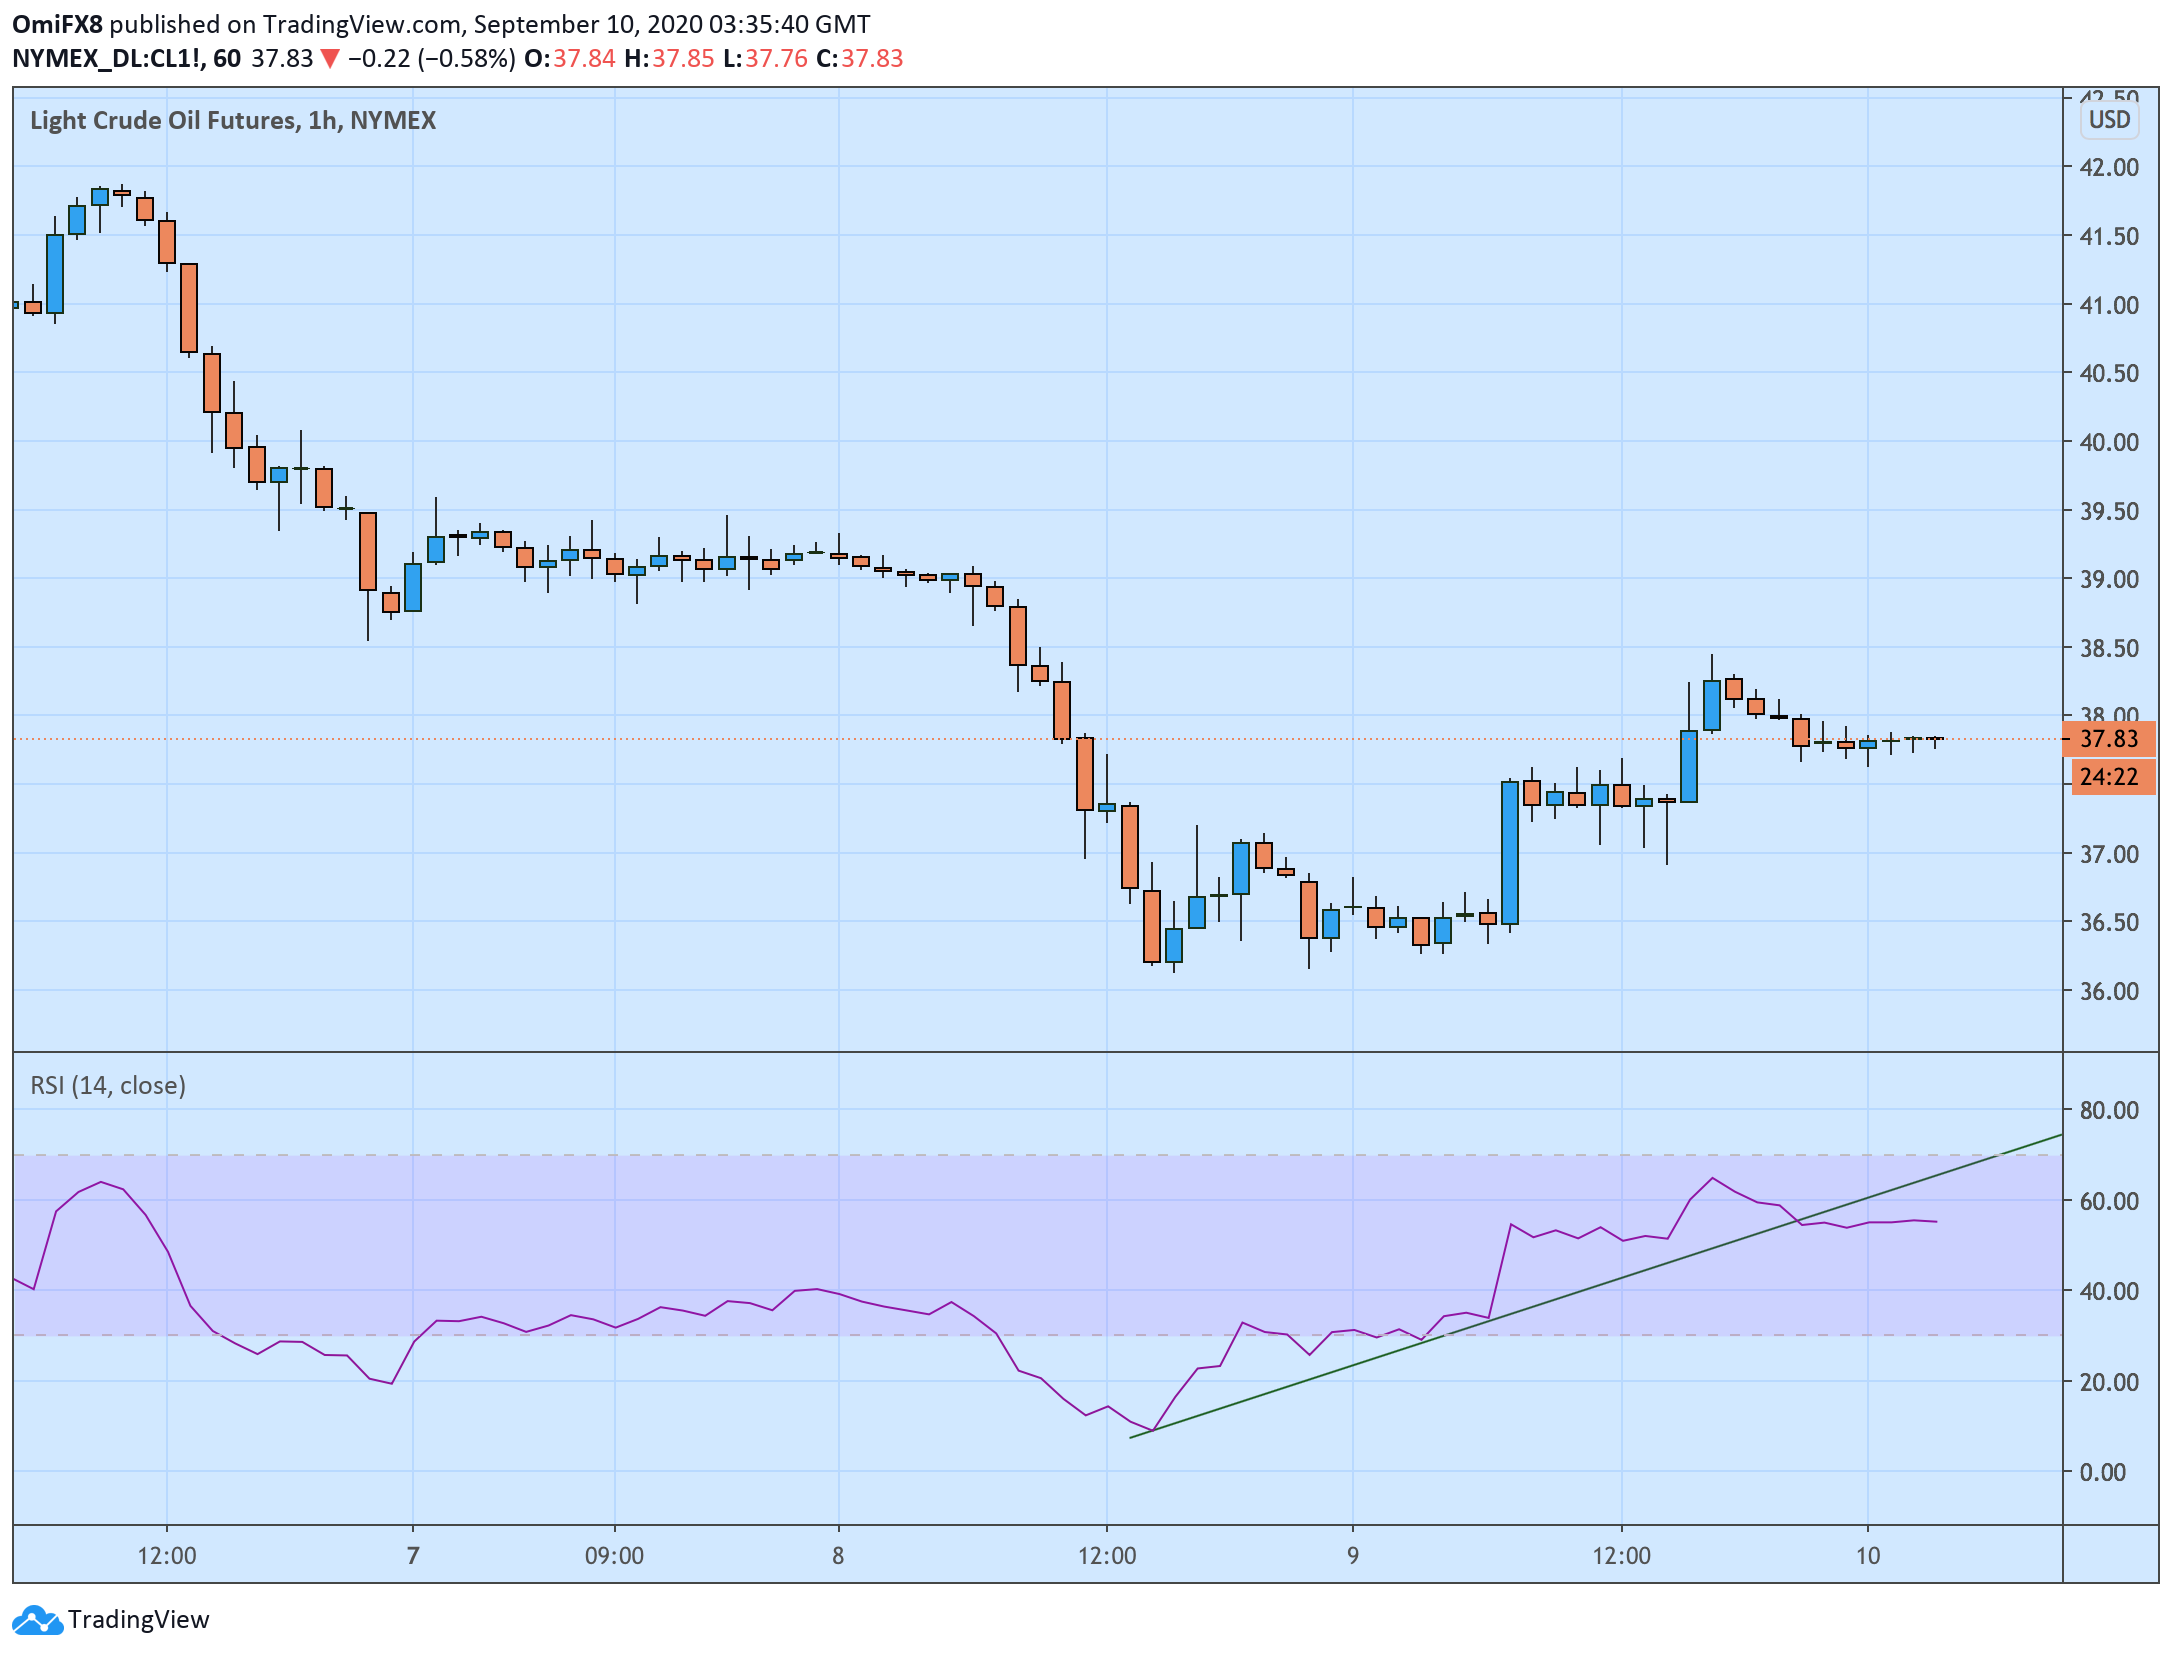
WTI Price Analysis: Hourly RSI shows corrective bounce has ended
- WTI trades near $37.80 versus $38.45 during the overnight trade.
- The hourly chart shows an end of corrective bounce from $37.00.
West Texas Intermediate (WTI) crude is currently trading near $37.80, representing a 0.7% decline on the day.
The hourly chart relative strength index has dived out of an ascending trendline, indicating an end of the black gold's bounce from weekly lows near $37.00.
The daily chart studies remain biased in favor of the bears. For instance, the 5- and 10-day simple moving averages continue to trend south, while the 14-day RSI hovers in bearish territory below 50.
As such, a re-test of $37.00 looks likely. Supporting the bearish case is the fact that major trading firms are again booking offshore oil storage tanks, a sign of weakening of demand.
A close above the descending 10-day SMA, currently at $40.66, is needed to invalidate the bearish outlook.
Hourly chart

Trend: Bearish
Technical levels
