USD/ZAR Price Analysis: Drops to 1-month lows, seems vulnerable to slide further
- USD/ZAR added to the overnight losses and remained depressed for the second straight day.
- The set-up favours bearish traders and supports prospects for further near-term weakness.
The USD/ZAR pair witnessed some follow-through selling for the second straight session on Thursday and dropped to near one-month lows, around the 16.80 region in the last hour.
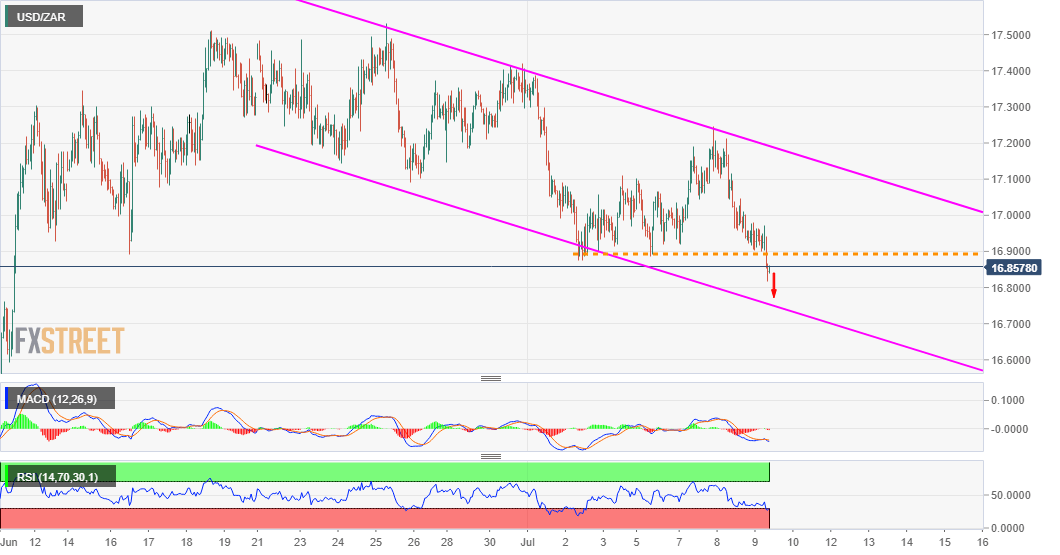
Given the overnight rejection slide from the top end of a three-week-old descending trend-line, a subsequent fall below the 16.90 horizontal support might now be seen as a fresh trigger for bearish traders.
The negative outlook is further reinforced by bearish technical indicators on the daily chart. However, slightly oversold conditions on the 1-hourly chart warrant some caution before placing fresh bearish bets.
Nevertheless, the pair still seems vulnerable to challenge the mentioned channel support, around the 16.65 region. Some follow-through selling will set the stage for an extension of the ongoing downward trajectory.
Bears might then aim to retest June monthly swing lows, around the 16.35-30 region, and eventually dragging the pair further towards testing sub-16.00 level, or support near the 15.85-75 horizontal zone.
On the flip side, the 17.00 mark now becomes immediate resistance. Any subsequent move up might still be seen as a selling opportunity and remain capped near the trend-channel resistance, around the 17.15-20 region.
USD/ZAR 1-hourly chart
Technical levels to watch