GBP/USD Price Analysis: Break of short-term support line probes three-week low under 1.2300
- GBP/USD prints three-day losing streak, extends pullback from 1.2467.
- Late-April low offers immediate support ahead of the multi-day-old horizontal line.
- A nine-day-old falling trend line restricts immediate upside.
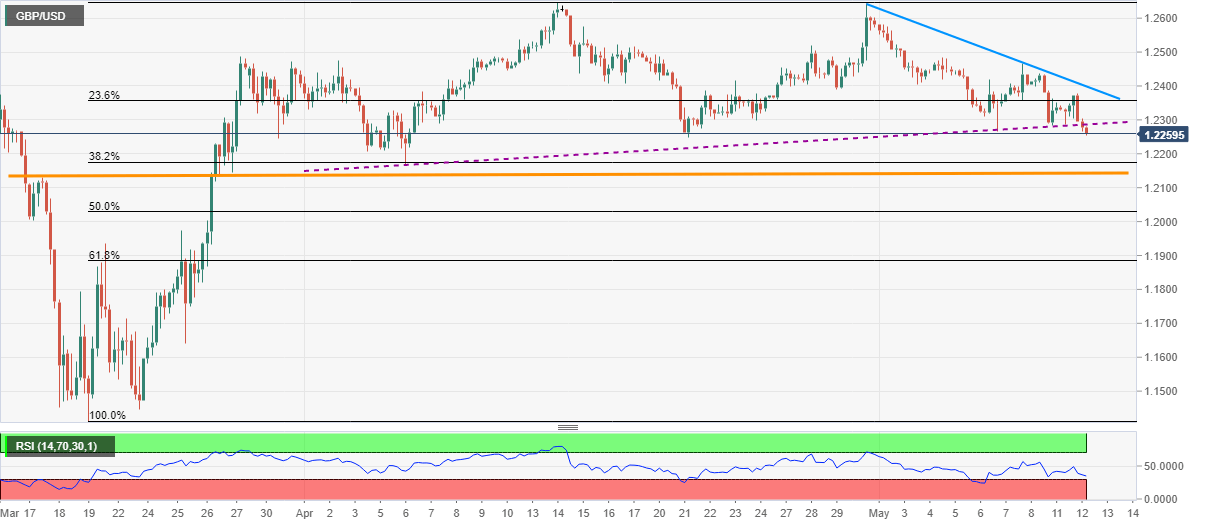
GBP/USD drops to 1.2257, intraday low of 1.2255, amid the initial Asian session on Wednesday. The pair recently broke an upward sloping trend line from April 06 while trading near April 21 low.
Although nearly oversold RSI conditions signal a pause in selling around the late-April low close to 1.2250/45, pair’s further downside can challenge the April month low near 1.2165.
However, horizontal support comprising March 18 top and late-March lows, surrounding 1.2140/45, can question bears afterward.
Alternatively, a descending trend line from April 30, at 1.2400 now, keeps the pair’s recoveries capped whereas the support-turned-resistance line near 1.2285 can check immediate buying.
In a case where the bulls dominate past-1.2400, 1.2470 and 1.2485 can offer intermediate halts before fueling the quote towards the previous month's top near 1.2650.
GBP/USD four-hour chart
Trend: Further downside likely