Back
12 May 2020
S&P 500 Price Analysis: Bullish correction remains in place, trades above 2900 mark
- The S&P 500 bullish correction from mid-March remains intact.
- S&P 500 found support near the 2900 level.
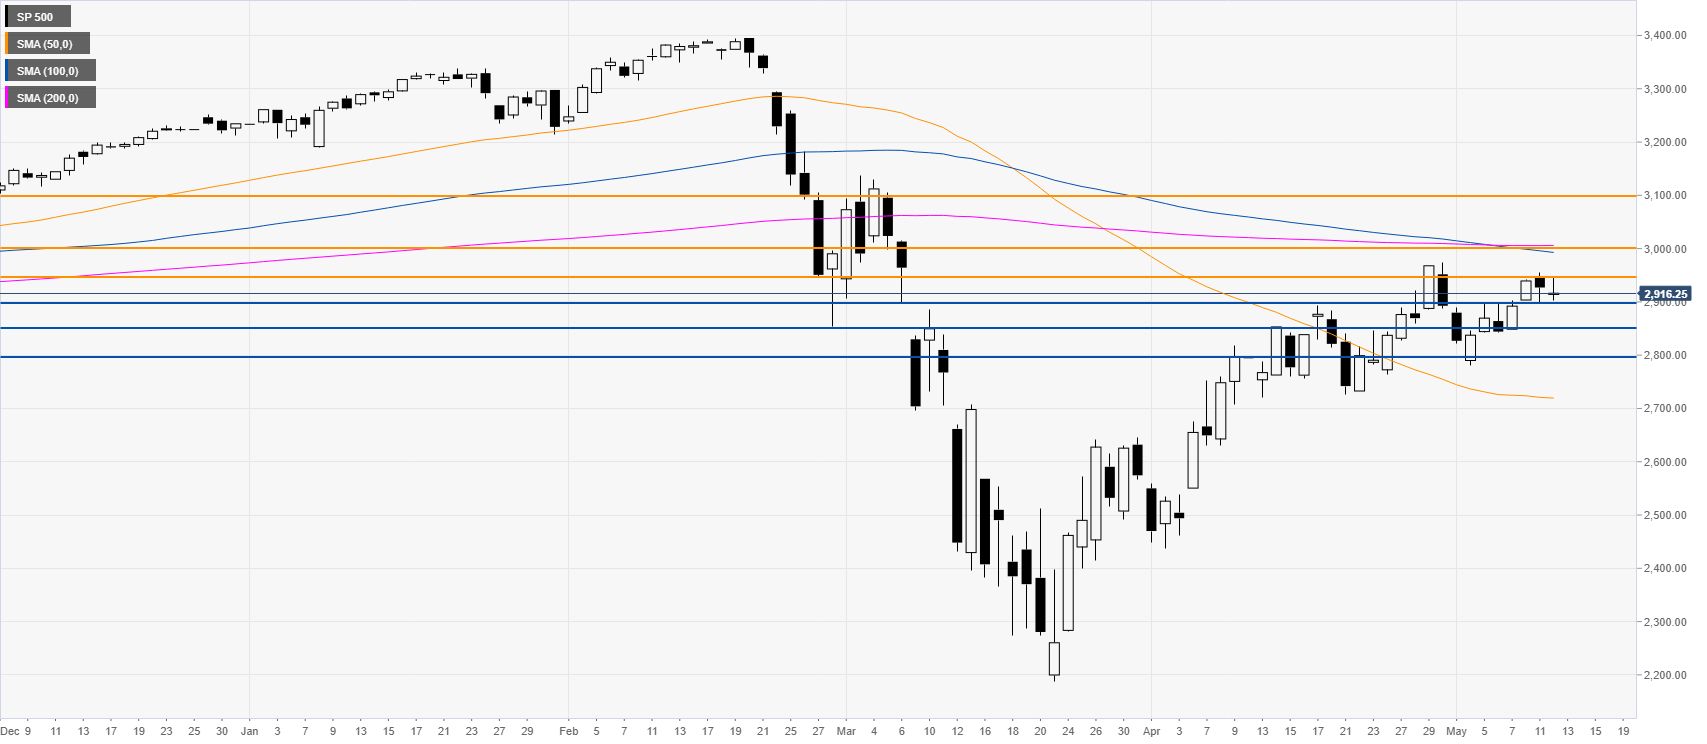
S&P 500 daily chart
The S&P 500 is trading in a strong bullish recovery after the sharp February-March crash. The market is consolidating the advance while above the 2900 mark and the 50 SMA on the daily chart. Bulls remain firmly in control as the S&P 500 is making higher highs and lows. Bulls will be looking to extend gains above the 2950 resistance en route towards the 3000 round figure near the 100 and 200 SMAs. On the flip side, support is expected to emerge near the 2900 and 2855 levels.
Additional key levels