Back
20 Mar 2020
S&P500 Price Analysis: US stock index grinds down further, hits lowest since February 2017
- S&P500 is resuming down after a few days of consolidation.
- S&P500 is trading in 37-month lows as coronavirus crisis is taking its toll.
- The level to beat for bears is the 2300 support.
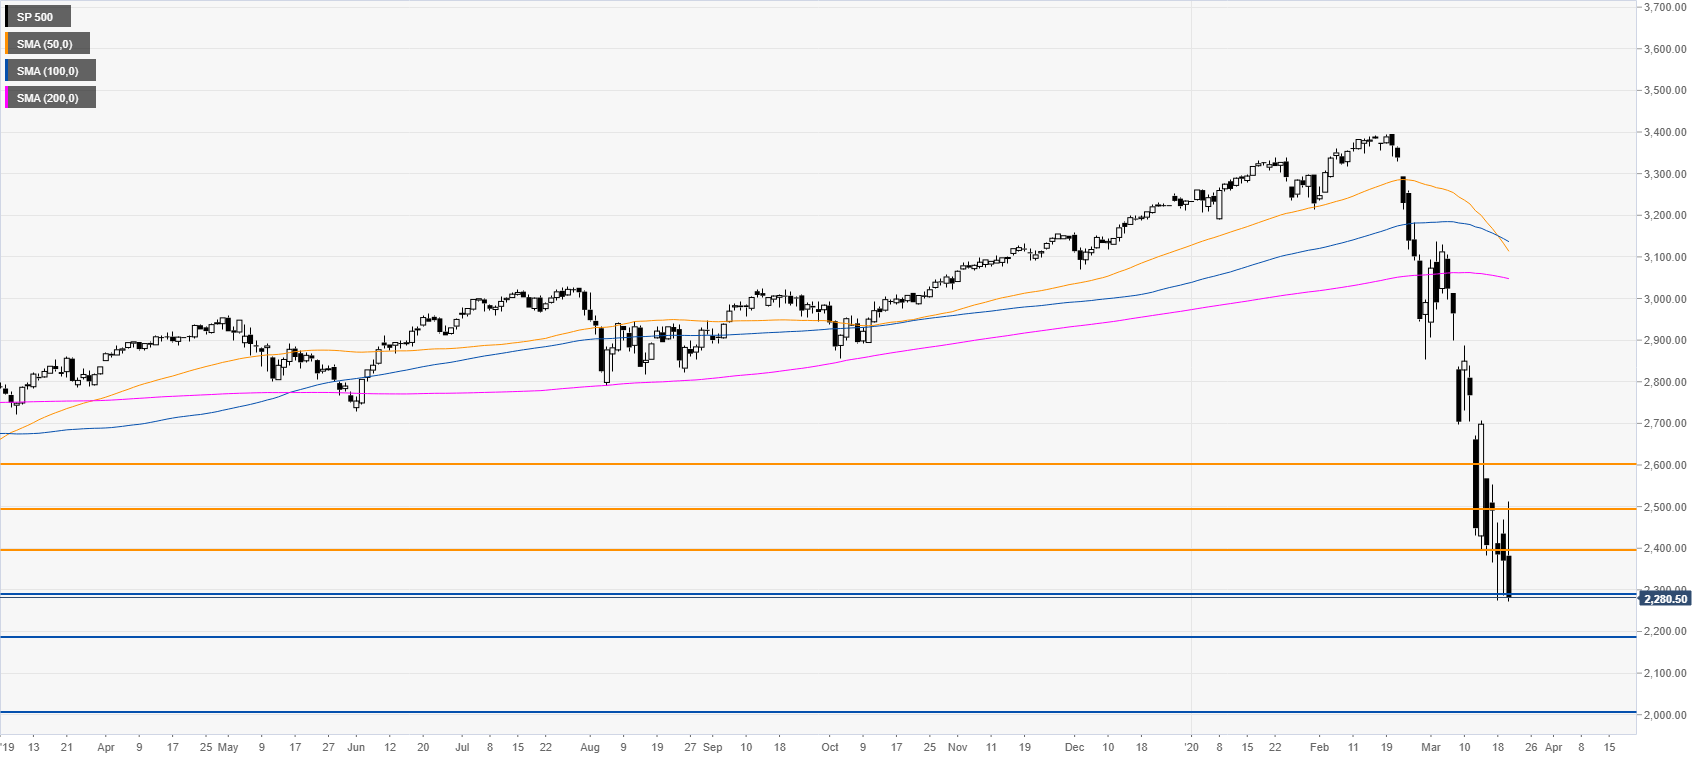
S&P500 daily chart
The market is resuming to the downside after a few days of consolidation. The S&P500 is now in a bear market as it dropped more than 20% from the recent record high while trading in 37-month lows. The drop below the 2300 level can lead to more declines towards the 2200 and 2000 price levels in the medium term. The 2400, 2500 and 2600 price levels should act as resistance.
Additional key levels