Back
4 Dec 2019
GBP/USD price analysis: Pound hangs near seven-months highs around 1.3100 handle
- The cable is trading at levels not seen since May 2019.
- The level to beat for buyers is the 1.3118 resistance.
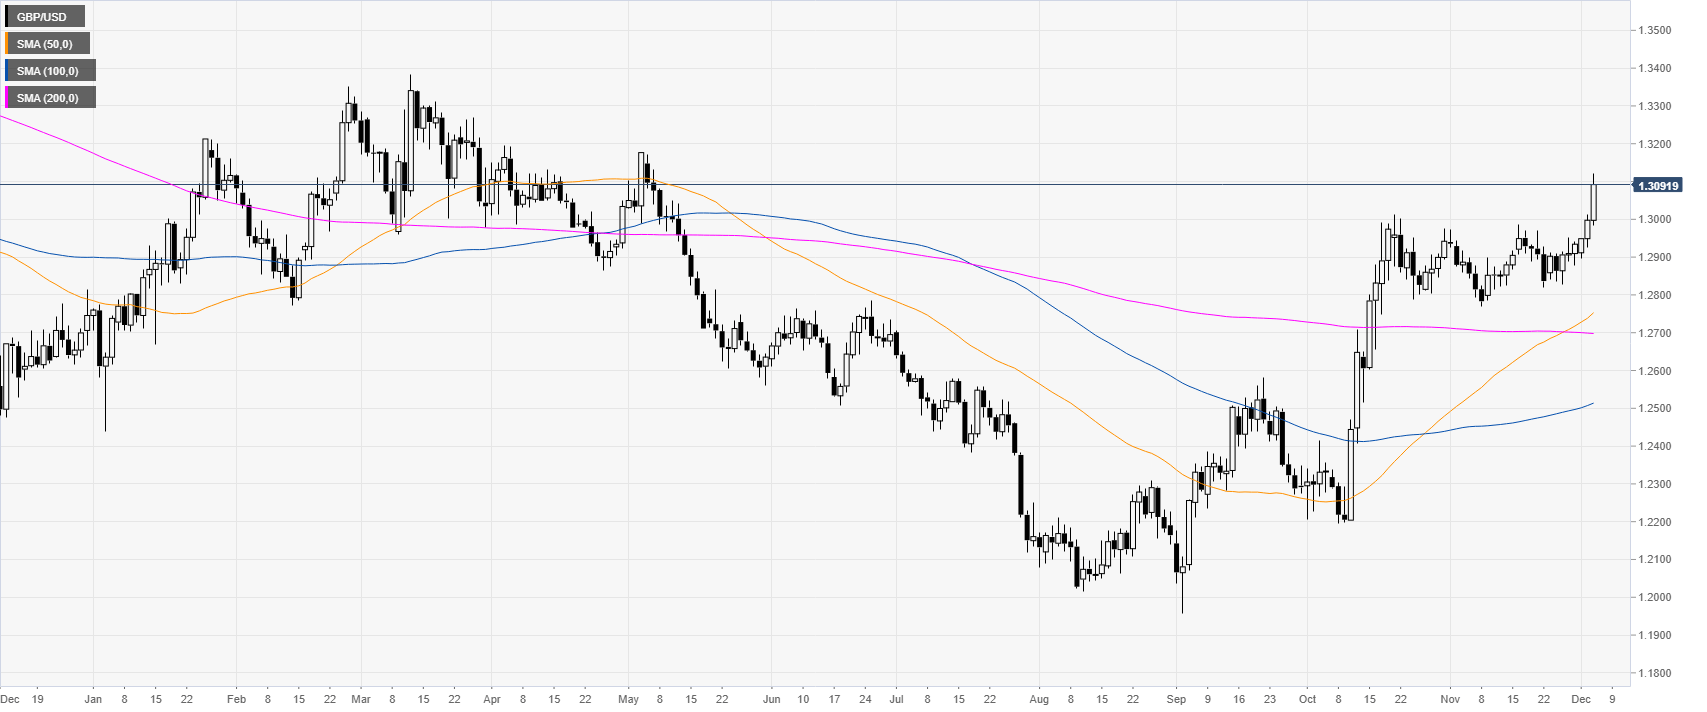
GBP/USD daily chart
After a consolidation period in November, the market finally broke to the upside hitting levels not seen since early May 2019.
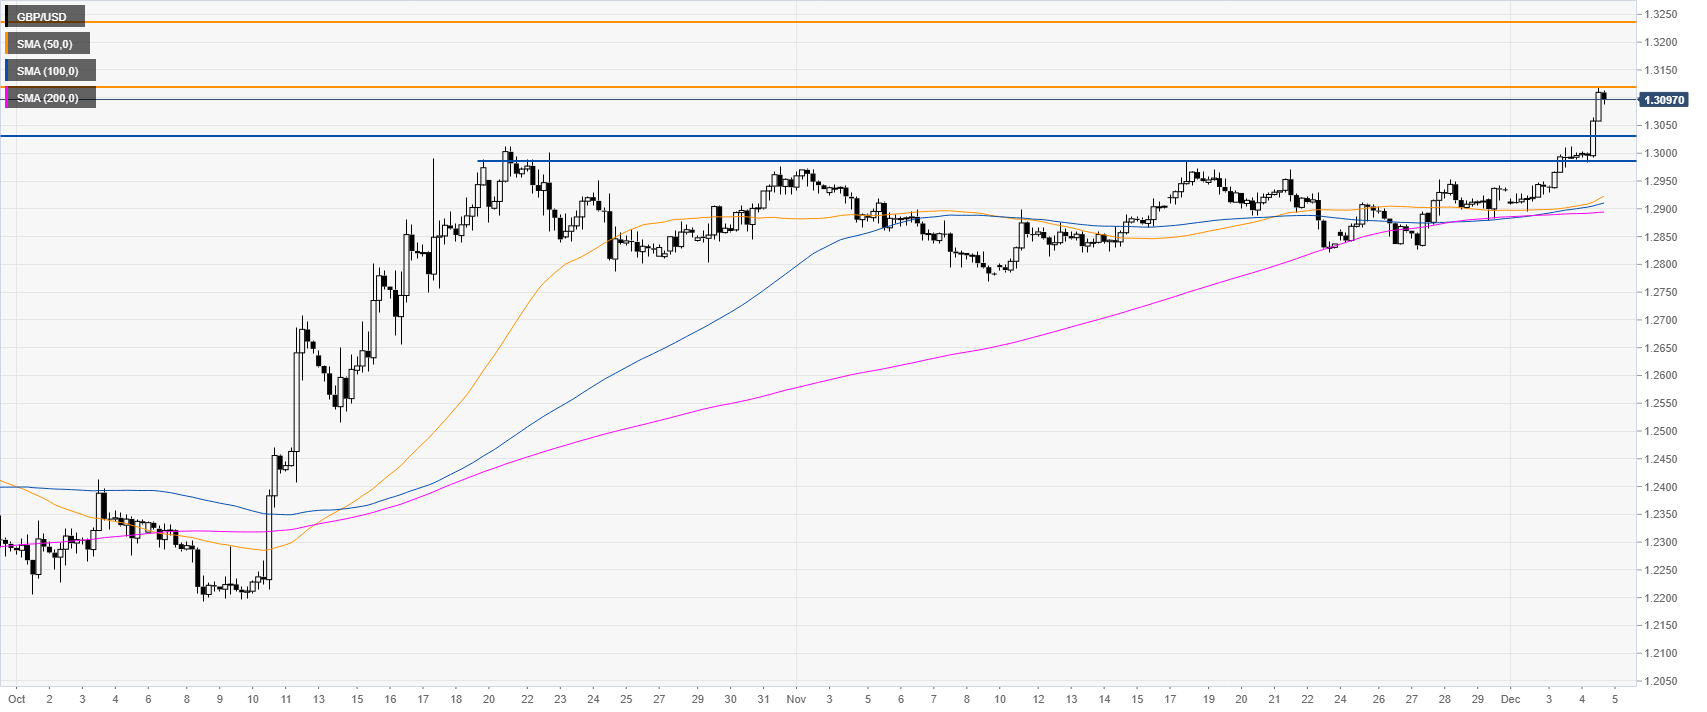
GBP/USD four-hour chart
The market is spiking to the upside while above the main simple moving averages. As the buyers are in control, the market will likely try to break above the 1.3118 resistance. The next pit-stop on the way up is seen at the 1.3242 level, according to the Technical Confluences Indicator.
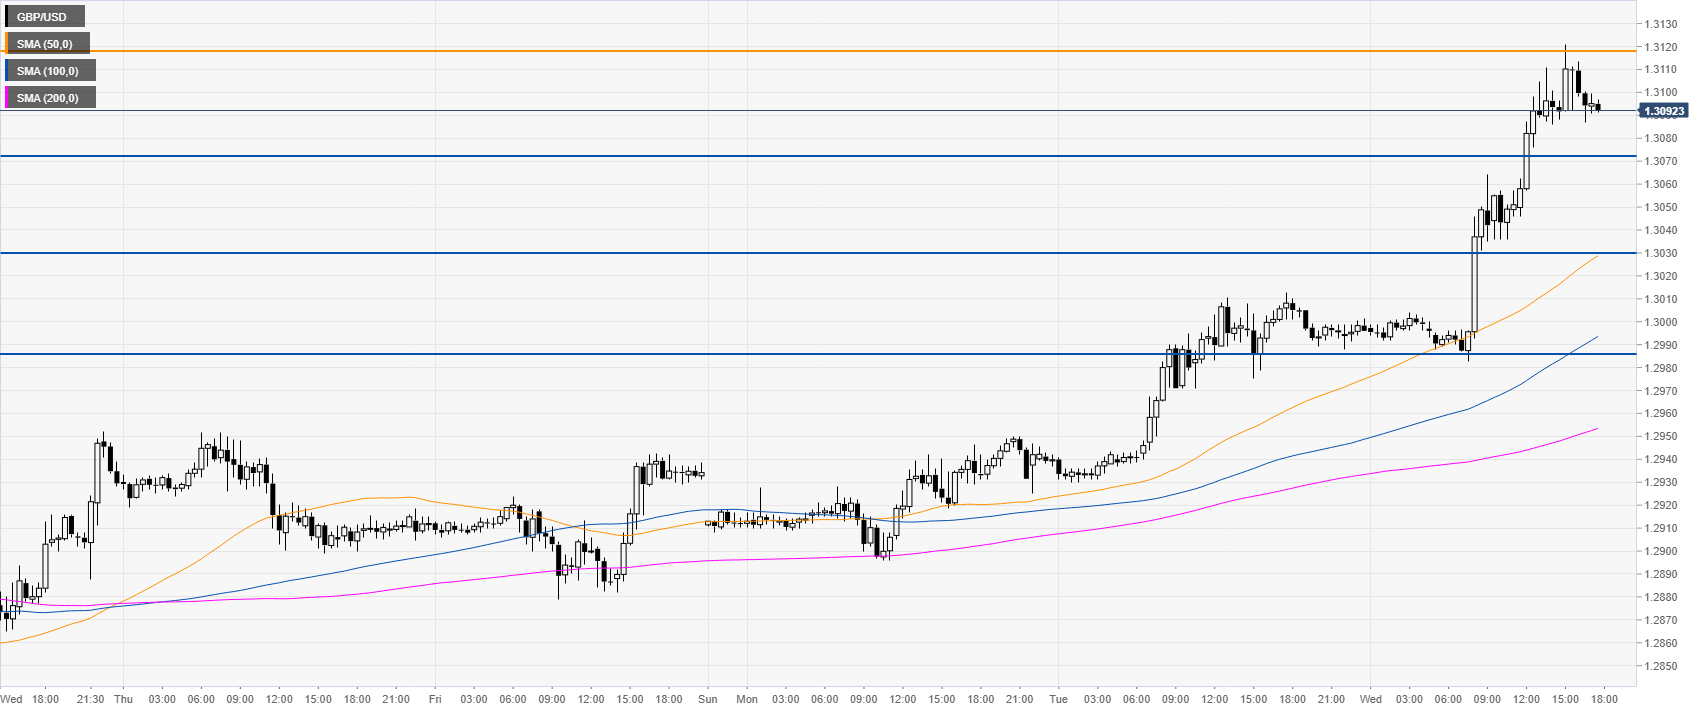
GBP/USD 30-minute chart
GBP/USD is climbing up above the main SMAs. Support is seen at the 1.3072, 1.3032 and 1.2984 price levels.
Additional key levels