Back
10 Oct 2019
AUD/USD technical analysis: Aussie easing from daily highs, trading sub- 0.6770 level
- AUD/USD is retracing down in the New York session after the inflation data in the United States.
- The US Core Consumer Price Index (CPI) came out as expected at 2.4% YoY.
- The level to beat for sellers is the 0.6752 support.
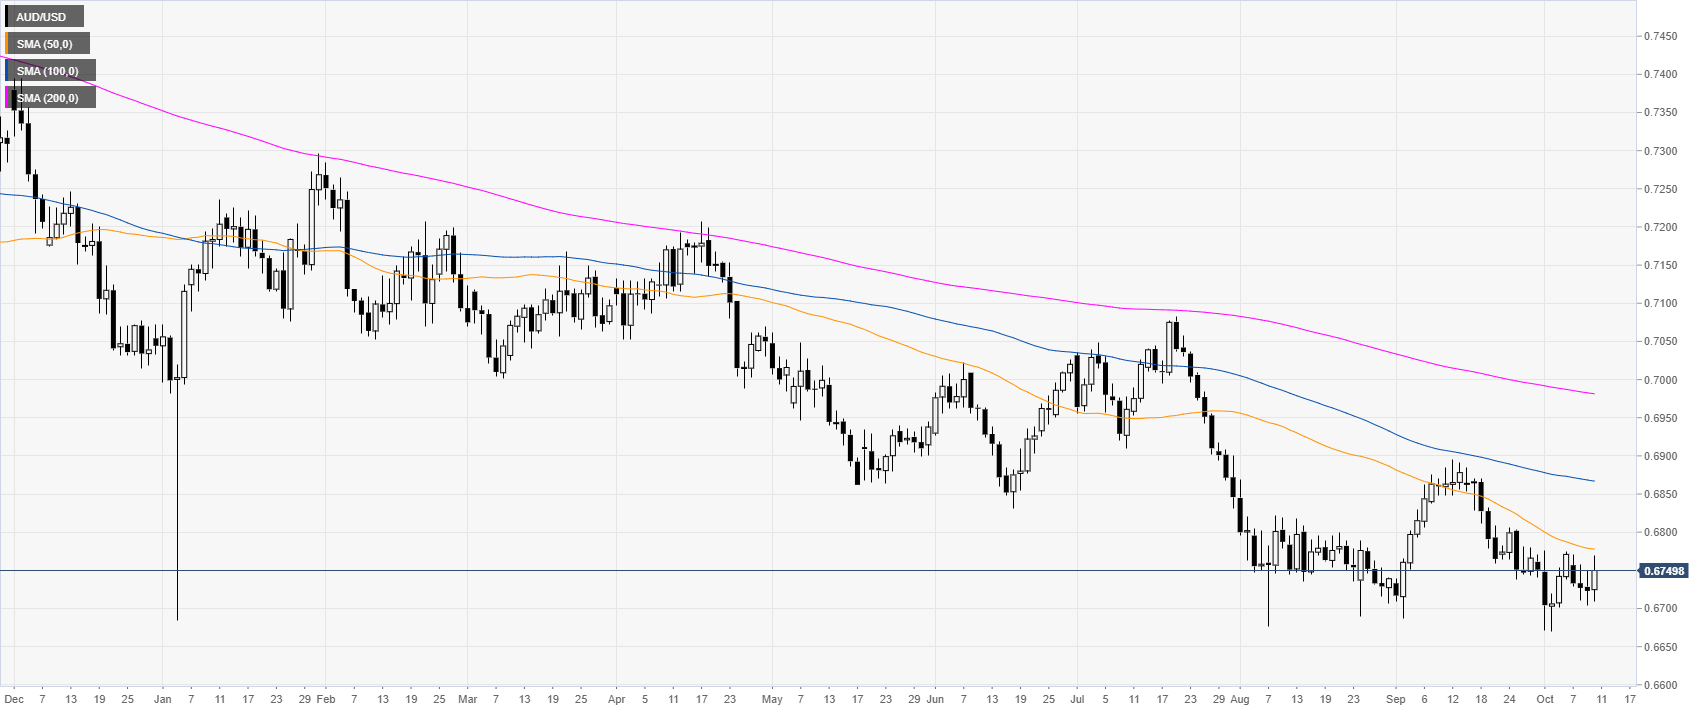
AUD/USD daily chart
The Aussie is trading in a bear trend below the main daily simple moving averages (SMAs) on the daily chart. This Thursday, the US Core Consumer Price Index (CPI) came out as expected at 2.4% YoY.
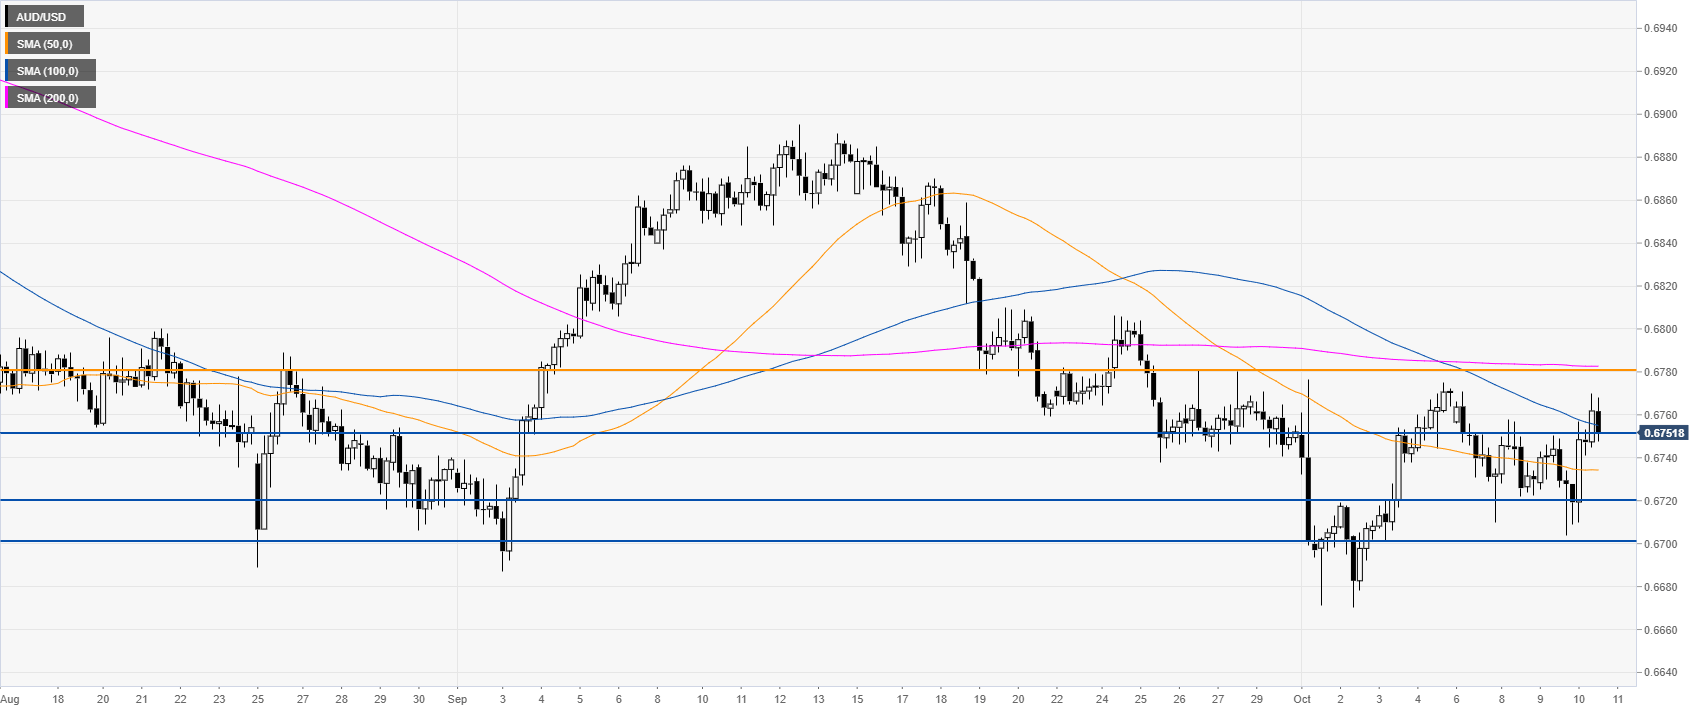
AUD/USD 4-hour chart
The AUD/USD exchange rate is trading between the 50 and 200 SMAs, suggesting a consolidation phase in the medium term. The market is challenging the 0.6752 support. A break below the level can see the Aussie going back to the 0.6720/0.6700 support zone, according to the Technical Confluences Indicator.
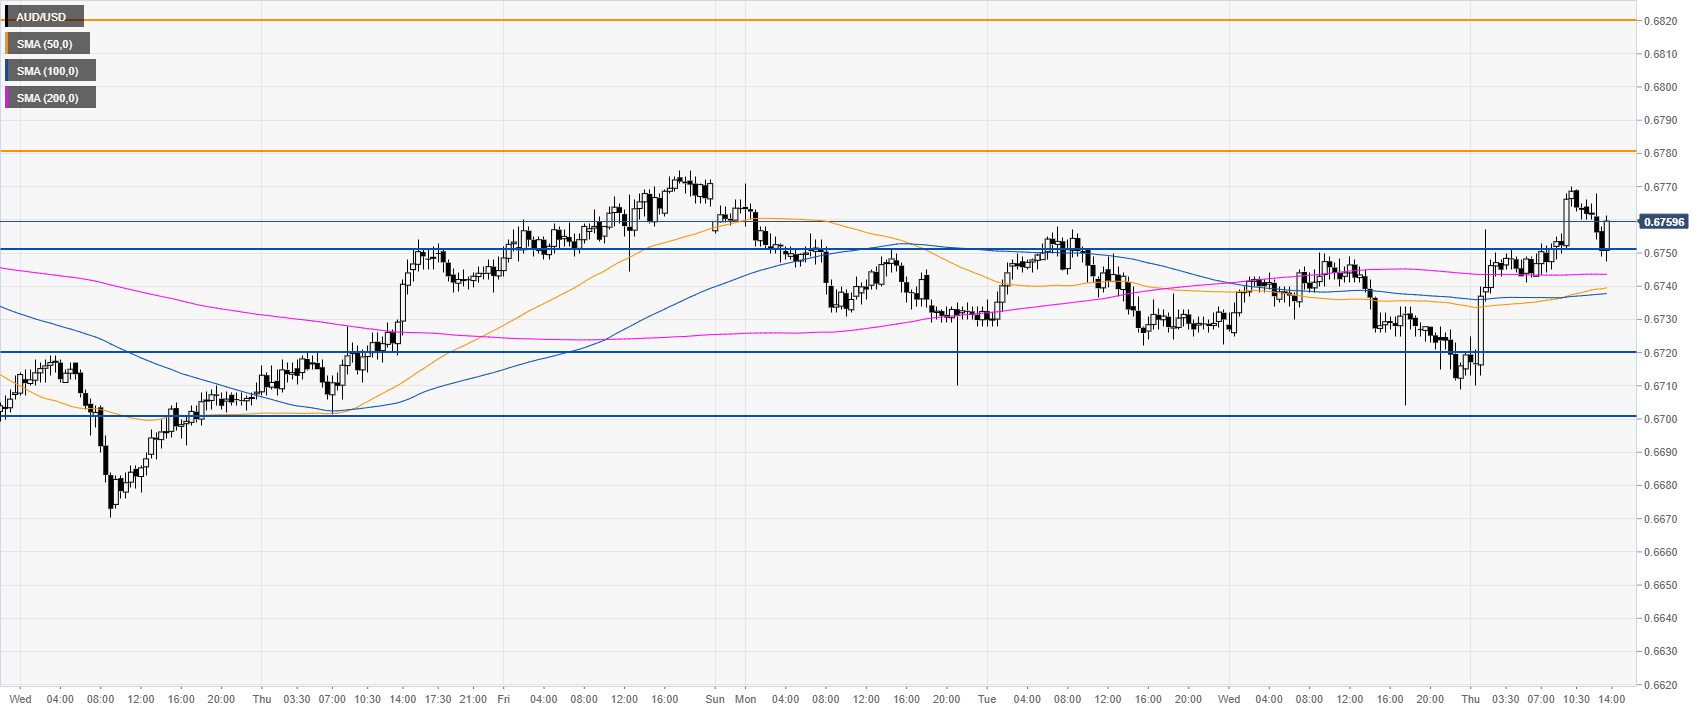
AUD/USD 30-minute chart
AUD/USD is trading above the main SMAs on the 30-minute chart, suggesting bullish momentum in the near term. Immediate resistances are seen at the 0.6780 and 0.6820 price levels.
Additional key levels