Back
8 Jul 2019
Oil technical analysis: WTI starts the week by challengeing the 58.00 handle
- Oil is gaining some ground above the 58.00 figure.
- 58.50 is the next level to beat for bulls.
Oil daily chart
WTI (West Texas Intermediate) is trading just below the 58.00 figure and its 50 and 100-day simple moving averages (DSMAs).

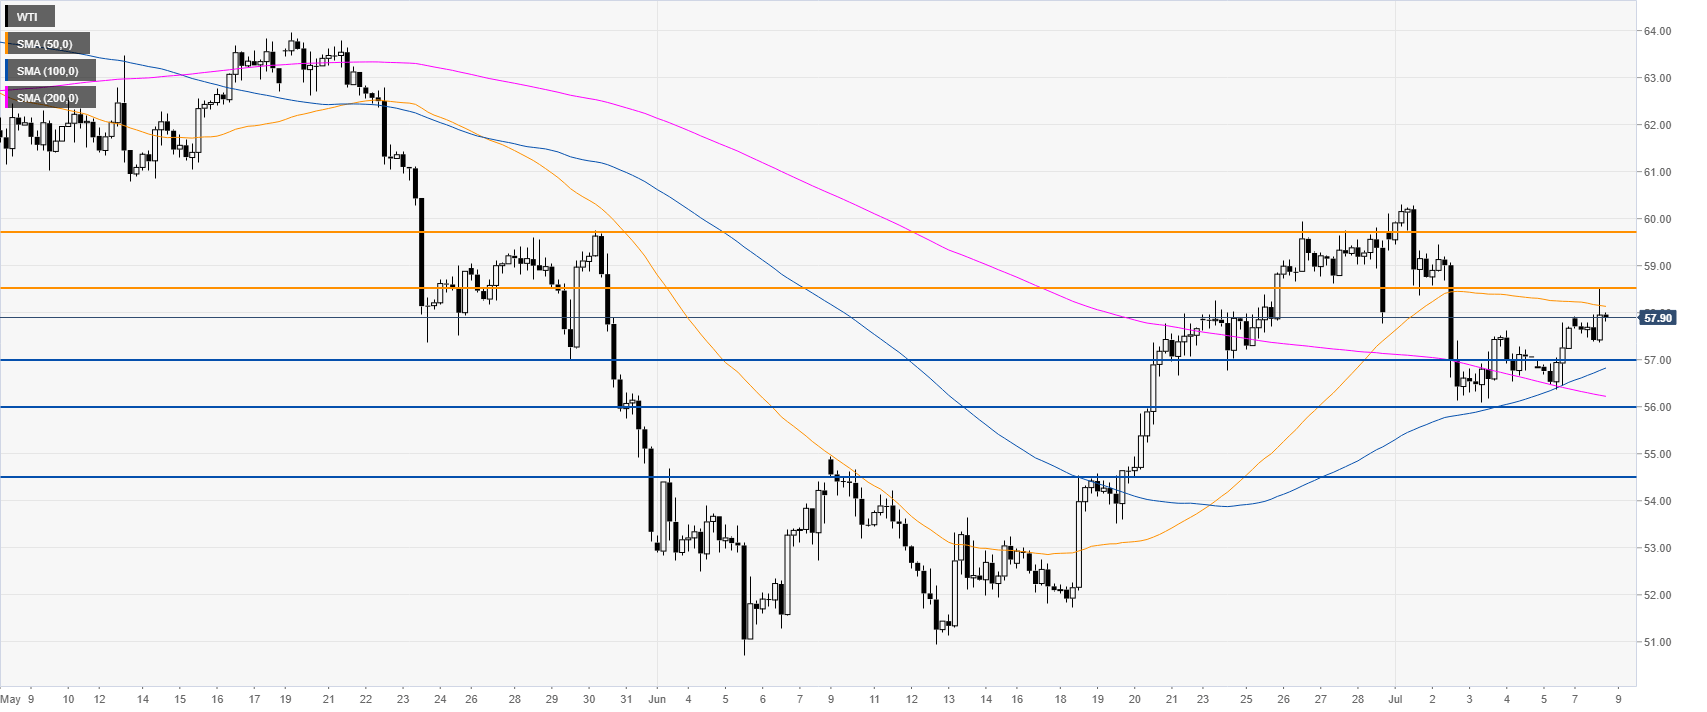
Oil 4-hour chart
Oil is grinding up near the 58.00 handle and its 100 and 200 SMAs. Bulls want to break 58.50 resistance to reach the 89.70 level.
Oil 30-minute chart
Oil is trading above its main SMAs suggesting bullish momentum in the near term. Immediate supports are seen at 57.40, 57.00 and 56.40. A daily close below 56.40 would question the bull case.

Additional key levels