USD/INR Technical Analysis: Mildly bid in early trade, but bias remains bearish
USD/INR is currently trading at 68.70, up 0.46 percent from the low of 68.3875 hit yesterday. The bounce, however, has done little damage to the bearish setup on the daily chart. The attention, therefore, remains on the support at 68.27.
Daily chart
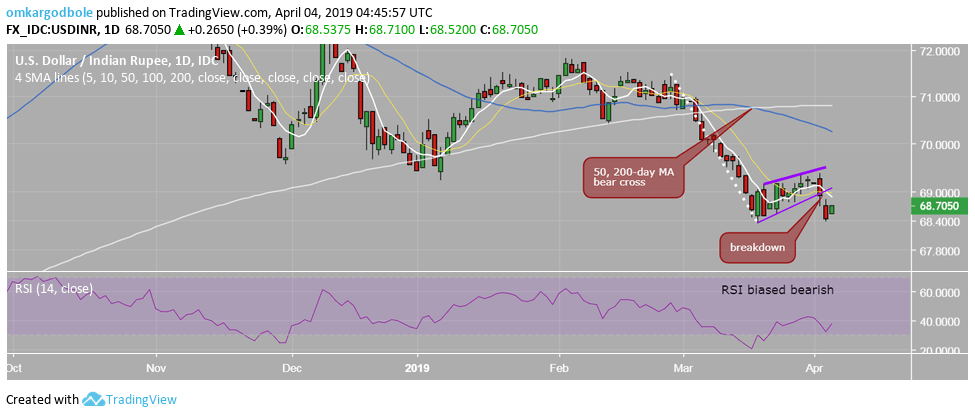
The pair fell 69.00 on Tuesday, confirming a bear flag breakdown on the daily chart. With the pair holding well below 69.00, that bearish continuation pattern is still valid and is supported by the death cross (50- and 200-day MA bear cross confirmed on March 25) and a below-50 print on the 14-day relative strength index (RSI).
As a result, the pair still appears on track to test the support at 68.27. Validating that bearish case are signs of bullish exhaustion in oil prices.
A break above 69.00 would weaken the bearish case, while a move above 69.37 (April 2 high) may invite buying pressures.
Trend: Bearish