USD/JPY price trapped between risk-off and monetary policy divergence
- Fed rate hike is likely coming next week so what will happen to the 105 USD/JPY support remains to be seen.
- The USD/JPY is struggling between risk-off and monetary policy divergence.
The USD/JPY is currently trading at around 106.70 down 0.26% on the day as US industrial data, JOLTS and Michigan consumer index come in better than expected earlier in the American session.
USD/JPY weekly chart
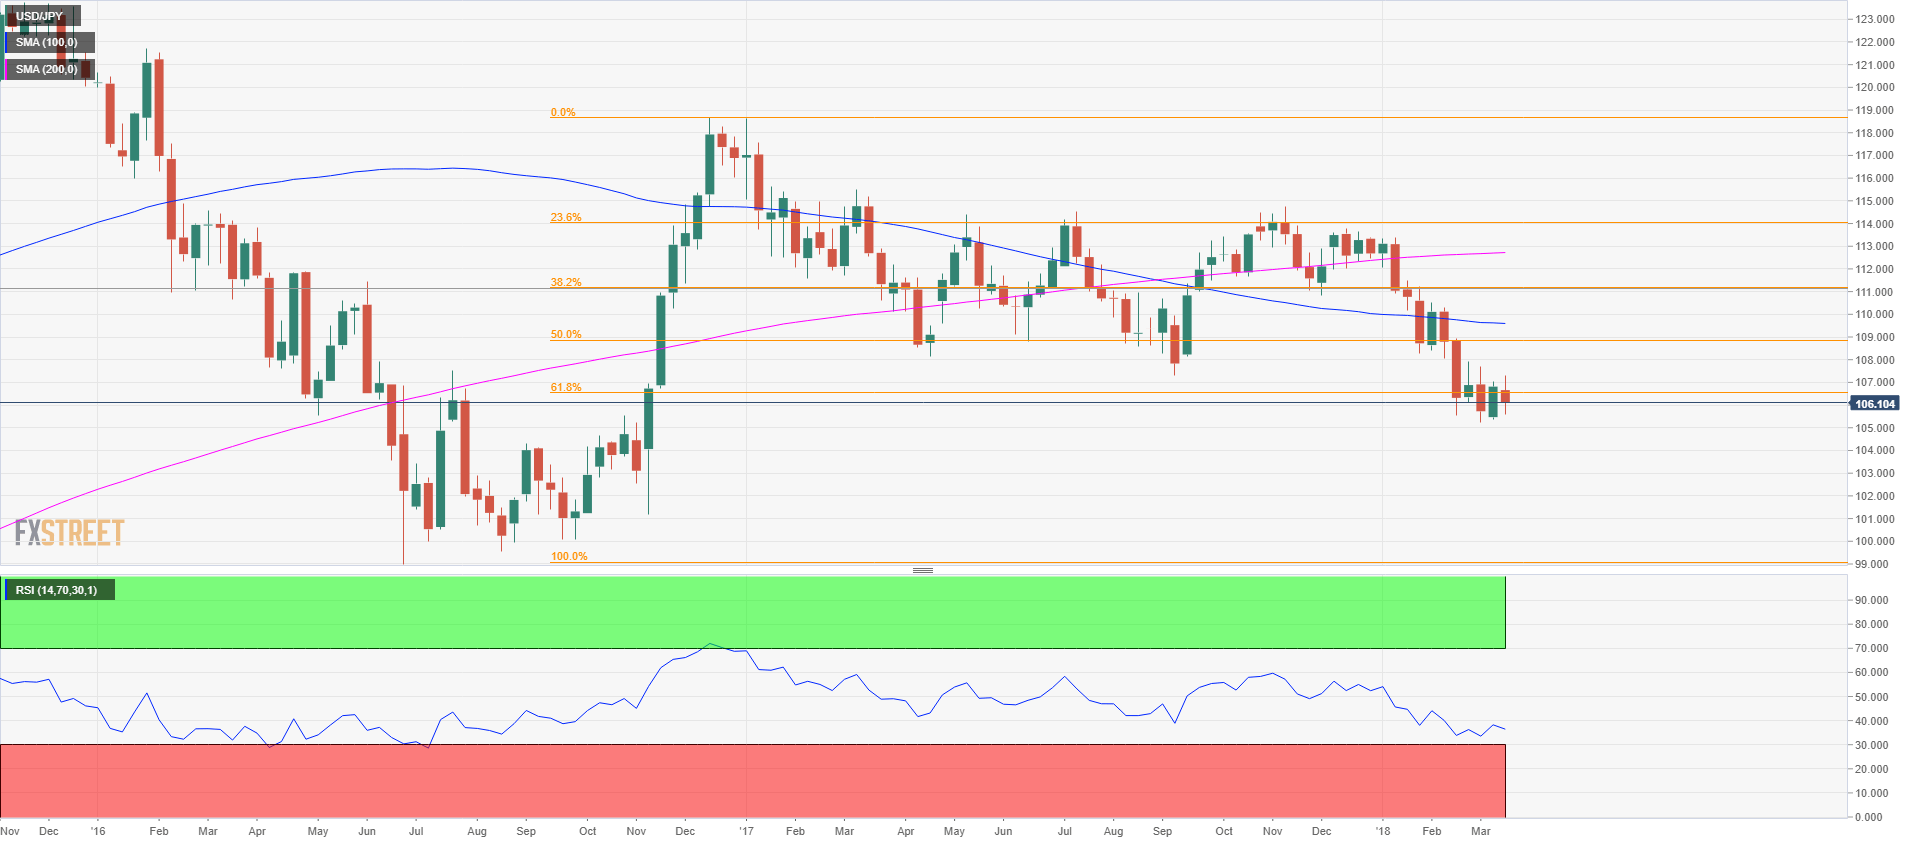
The USD/JPY has been steadily declining since the start of the year. On a weekly basis, the bulls were never able to close a bar above a previous week’s high, therefore suggesting a strong bearish momentum in the pair. However, this week was different as the bulls were able to break above the previous week’s high, which is the first time since 2018. It doesn’t mean the bearish trend is coming to an end but it informs us that bulls are indeed at work and trying. In the last four weeks, bulls have tried to break above 107 and 108 key levels but they are having a hard time so far as sellers seem relentless to bring the market back to 105. The Yen has benefited from a lot of risk-off sentiment among political scandals in Japan, Trump’s trade wars and UK-Russia relations deteriorating on the back of an attempted murder of an ex-Russian spy in the UK. Nothing to get bored about. However it is worth noting that the monetary policy divergence theory, from the Fed and the Bank of Japan, would still theoretically support higher USD/JPY in the medium run as the Bank of Japan keeps its aggressive easing monetary policy and the Fed is most likely to raise rates no less than four times this year, according to most analysts. However, we will let the market dictate the price and follow the trends.
Technically, the USD/JPY is consolidating and coiling at around 106.60, the 61.8% Fibonacci retracement from the July-December 2016 bull move. A decisive break and close above the 107-108 key area might confirm that bulls have the upper hand and a bottom might possibly be in place. To the flip side, if bulls are unable to support the market and 105 level support break, then 103.50 is likely next as it is the 78.6% Fibonacci retracement level.
USD/JPY daily chart
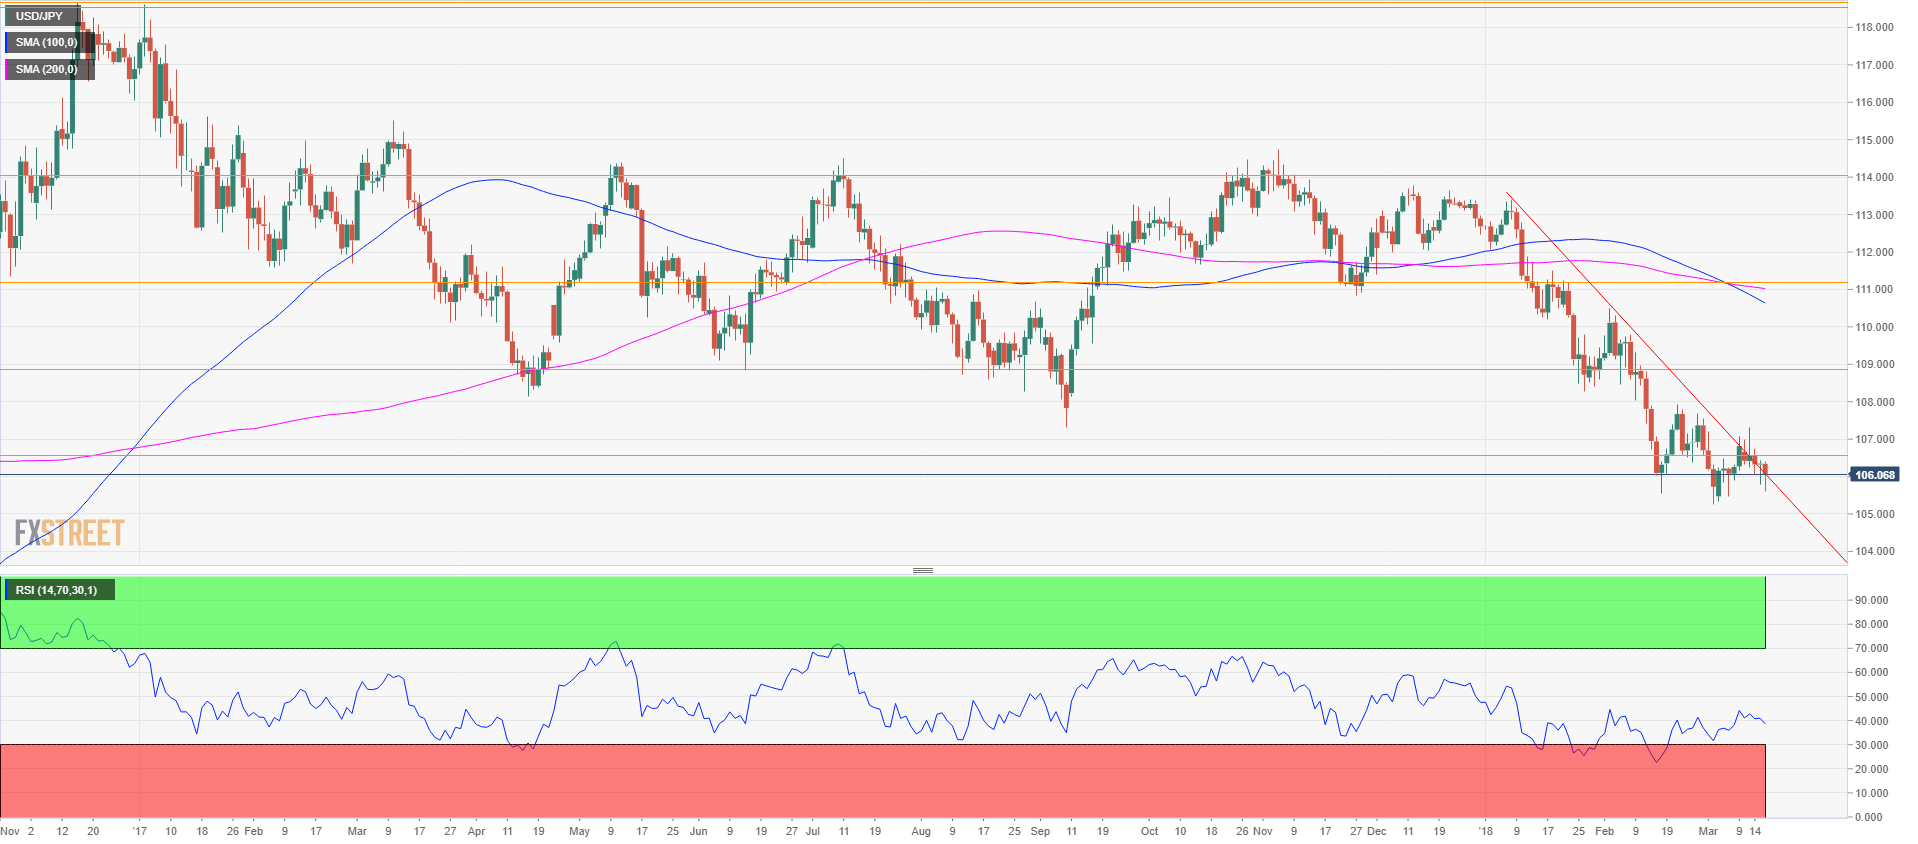
Bulls managed to break above the descending trendline although the bullish momentum has been weak after the breakout. The daily RSI is posting a bullish divergence as the market has been pretty much in balance for the last 4 weeks of trading.