EUR/JPY Price Analysis: Bulls prevail in the short-term sphere, investors start to take profits
- Indicators from the hourly chart show that buyers are taking profits.
- As long as the cross holds above its main SMAs, the outlook will be positive.
The EUR/JPY is changing hands at 164.74, up by 0.28%. The buyers demonstrate a stronghold in the market, which has led to ascending buying momentum. On the hourly chart, indicators are correcting oversold conditions so the upside might be limited for the immediate short term.
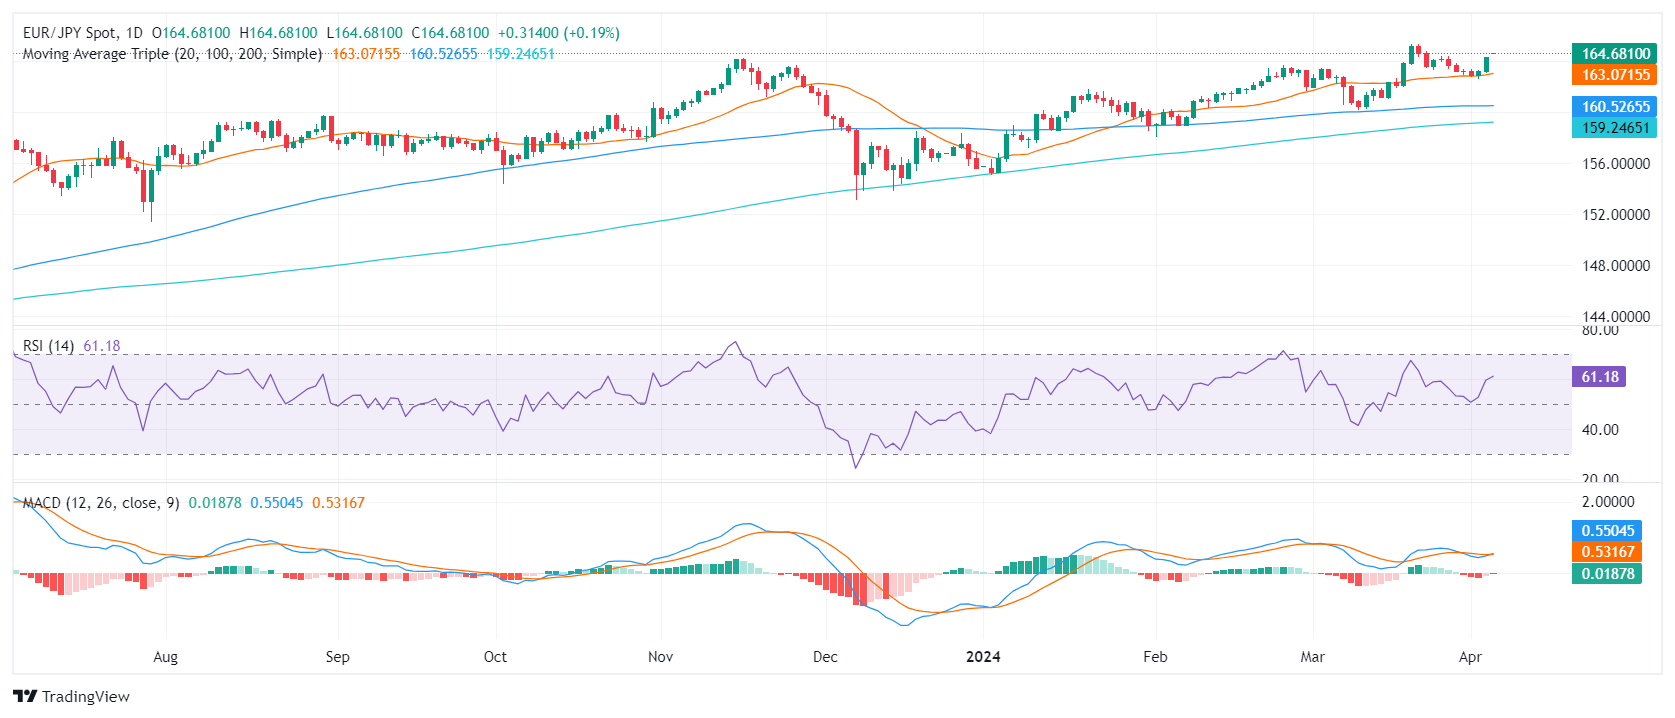
On the daily chart, the Relative Strength Index (RSI) currently situated in the positive territory, suggests a strong prevalence of buyers in the market. Additionally, decreasing red bars on the Moving Average Convergence Divergence (MACD) histogram indicates a weak bearish momentum.
EUR/JPY daily chart
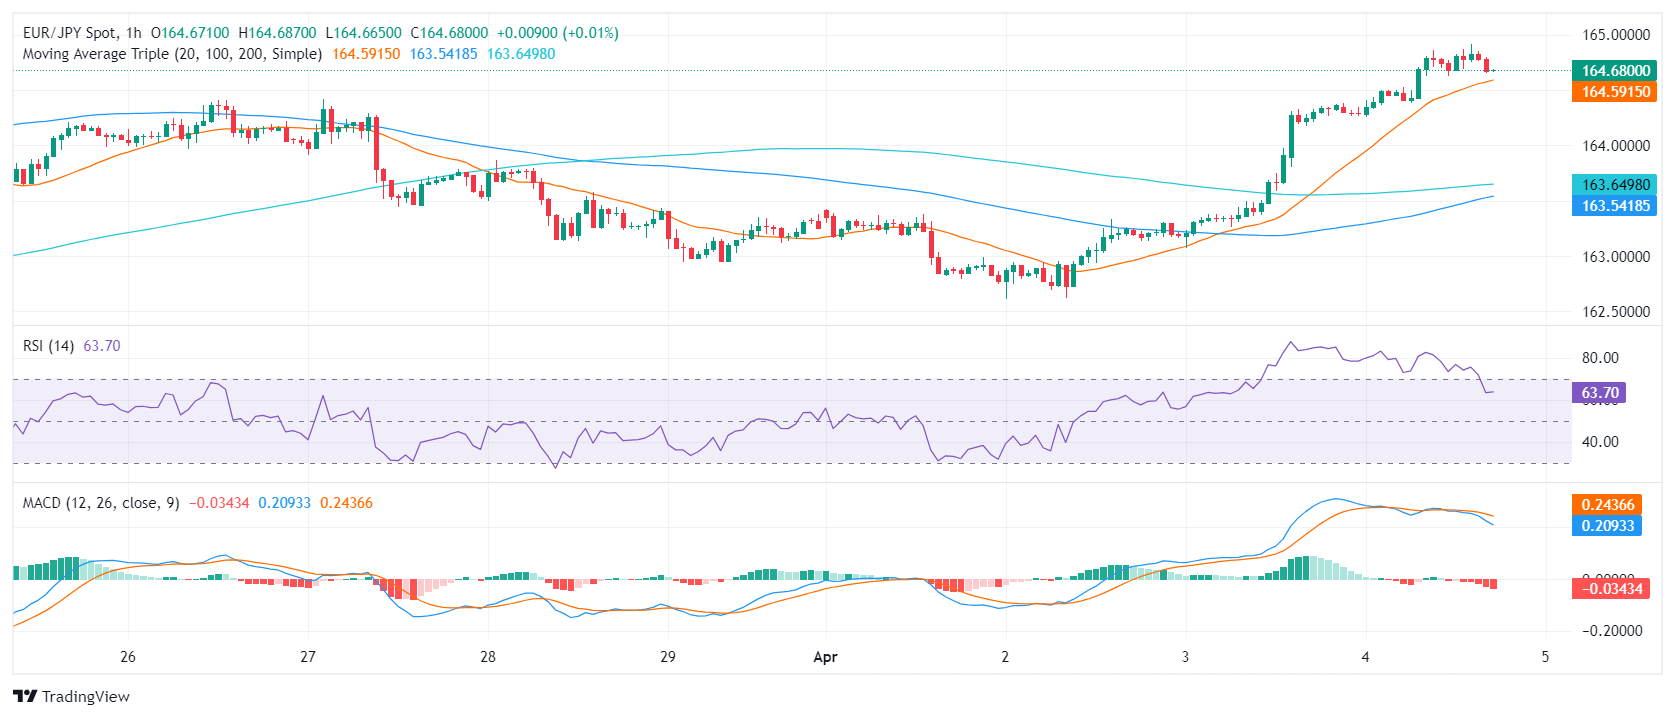
Looking at the hourly chart, the RSI, all values well above the mid-line but pointing south which suggests that the buyers are losing steam. Furthermore, rising red bars on the MACD histogram add more arguments for the bears stepping in.
EUR/JPY hourly chart
The broader market outlook harbors mixed signals as the EUR/JPY hovers above the 20, 100, and 200-day Simple Moving Averages (SMAs) which implies that the overall trends continue to be bullish. In summary, although indicators advocate for a bullish bias, a close observation of short-term bearish signals emitted by the declining RSI on the hourly chart is crucial.